This web page was produced as an assignment for Gen677 at UW-Madison Spring 2009
NFAT dysregulation by increase dosage of DSCR1 and DYRK1A on chromosome 21 (Arron et al)
The focus of this paper was determine the effects that a 1.5 -fold increase in gene dosage has on the phenotypes related to Down's Syndrome. They focused on two genes that are located within the critical region of he 21st chromosome: DSCR1 and DYRK1A. These two genes were found to inhibit the the function of NFATc transcription factors which in turn resulted in phenotypes resembling those of Down's Syndrome individuals. Their conclusion were derived from four separate experiments: Phenotypes of Nfatc-null mice, The Down's syndrome critical region, Consequences of increasing Dscr1 and Dyrk1a dosage, and Mathematical modelling of the NFAT genetic regulato circut.
Phenotypes of Nfatc-null mice
Initially the experimenters set out to prove that removal of Nfat proteins would result in phenotypes resembling that of common Down's Syndrome phenotypes. To do this they created double mutant mice with knock-outs in Nfatc4 and Nfatc2. These double mutant mice showed reduced length in many aspects of skull bone structure (shown in Figure 1a-c), which is representative of phenotypes displayed in Down's Syndrome individuals. They also showed that a triple mutant including Nfatc3 knock-out, showed a failure in come interneuron development which suggest a link to cognitive and behavioral defects. The authors state that while 'no individual NFATc mutant mouse reproduces all Down's syndrome pathologies, the features of Down's syndrome seem to be mild forms of NFATc mutant phenotypes'. (1)
Figure 1
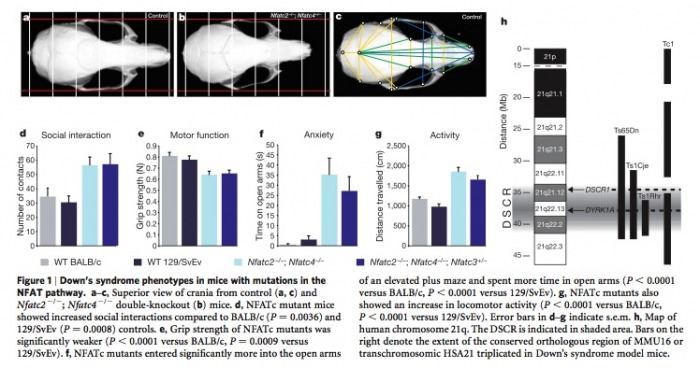
The figure above shows that double knock-out mice (b) show a smaller skull size when compared to control wild-type mice (a & c). The graphs (d-g) show that mutant mice have higher levels of social interactions, lower motor function, higher anxiety, and higher activity when compared to wild-type mice, all of which are common of Down's syndrome individuals. The final part of the figure (h) show a schematic view of the critical region of the 21st chromosome, including the two genes of interest DSCR1 and DYRK1A both found in the DSCR region of the chromosome.
*For a larger view of the figure please click on the picture above
The Down's syndrome critical region
Once it was confirmed that NFATc proteins indeed play a role in the result of Down's syndrome phenotypes the researches wanted to establish relationships between the NFATc proteins and the 1.5-fold increase in the 21st chromosome. Their inquiry into the DSCR region led them to discover that DSCR1 encodes an inhibitor of calcineurin/NFAT signalling. They were able to show that DSCR1 is triplicated in mice showing Down's syndrome-like defects and that ithe protein was expressed at higher levels in fetuses with Down's syndrome. They then identified DYRK1A as a sequence that encodes a kinase which acts as a primer for substrates that will be phosphorylated by GSK3. GSK3 has been shown to phosphorylate NFATc proteins which will inactivate them and allow for their transportation out of the nucleus where they act as transcription factors. Like DSCR1, DYRK1A is also shown to be expressed at higher levels in Down's syndrome fetuses.(1) For an analysis of the relationship between DYRK1A and nuclear export of NFATc please refer to Figure 2 below.
Figure 2
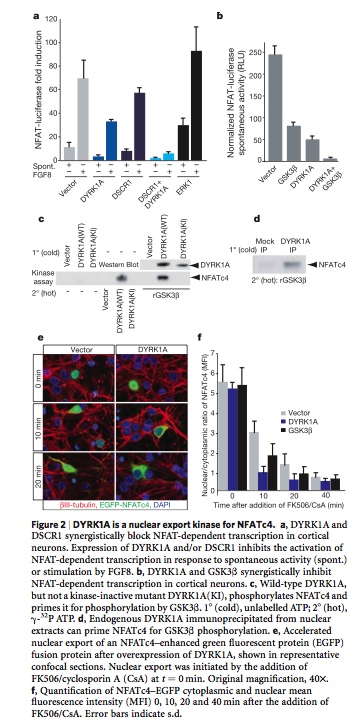
(a) Shows the effects of DSCR1 and DYRK1A on the level of NFATc-dependent transcription. Both DSCR1 and DYRK1A show a reduction in the abilities of NFATc to regulate transcription. (b) Also shows a decrease in NFATc activity when inhibited with DYRK1A. (c) Here is can be seen that when DYRK1A is mutated it no longer shows the ability to prime NFATc for phosphorylation and transport from the nucleus, unlike the wild-type version of DYRK1A. (d) Reiterating the fact that when DYRK1A is present NFATc is primed for phosphorylation. (e) When DYRK1A is overexpressed (right column), NFATc (green) is shown to be removed from the nucleus (purple) at a greater rate than that of the control. (f) A graphical depiction of the nuclear to cytoplamic ratio of NFATc. In DYRK1A overexpression mutants this ratio shows a significant decrease when compared to the control.
Consequences of increasing Dscr1 and Dyrk1a dosage
Here nine lines of double transgenic mice were developed, which overespressed Dyrk1a and Dscr1 during the development of the embryos. Overexpression of these two proteins resulted in decreased levels of expression of NFATc target genes, and hyperphosphorylation of NFATc1. These mice also showed heart developmental defects. These results were comparable to those found in NFATc knock-out mice. (See Figure 3)
Mathematical modelling of NFAT genetic regulatory circut
Mathematical modelling was used to predict outputs of NFAT signalling. Through these modelling mechanisms a couple of generalizations were discovered: DSCR1 and DYRK1A show additive effect if initial concentraitons of each component are considered and target genes of NFAT complexes may not be transcribed when there is an increase of DSCR1 and/or DYRK1A by 1.5-fold (1). These predictions were then tested by examining three human Down's Syndrome fetuses and three controls of same-aged fetuses. Observations of hyperphosporylation of NFAT complexes in the brain and heart tissues in Down's Syndrome individuals were consistent with the models developed. (Figure 4)
Figure 3 Figure 4
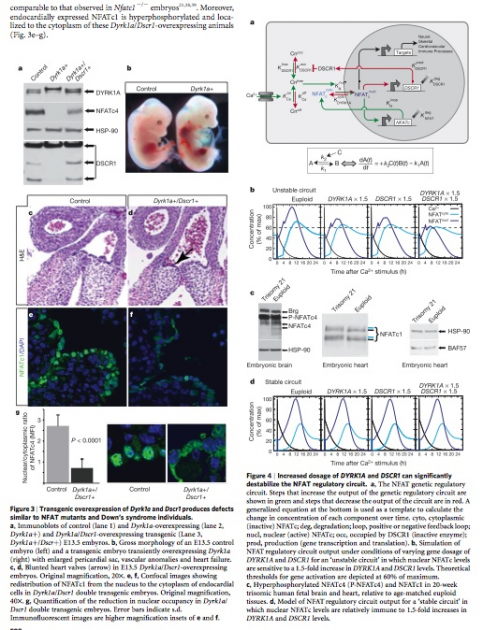
Figure 3: (a) Overexpression of Dyrk1a results in a decrease endogenous DSCR1 expression as well as NFATc4 protein expression (lane 2). (b) The Dyrk1a overexpressing embryo displays an enlarged cardiac region when compared to control embryo. (c-d) The arrow in d indicates the area in the heart valve that is blunted due to overexpression of Dyrk1a and Dscr1. (e-f) NFATc1 has been transferred to the cytoplasm of endocardial cells in the Dyrk1a/Dscr1 overexpressing mutant. (g) A decrease in the nuclear to cytoplasmic ratio is seen in the double expressing mutant.
Figure 4: (a) A schematic of the normal NFAT genetic regulatory circut. Green arrows show an indication of increase in output, while red arrows indicate a decrease in output. (b) Nucleotide levels of NFAT are decreased in overexpressing mutants. (c)Hyperphosporylation of NFATc4 and NFATc1 shown compared to euploid control tissues. (d) In a stable circut NFATc levels display immunity to increases in DYRK1A and DSCR1
(For a larger view of Part (a) of this figure click on this link.)
References:
1. Arron et al. (2006) NFAT dysregulation by increased dosage of DSCR1 and DYRK1A on chromosome 21. Nature v.441 Retrieved February 9, 2009, from http://www.nature.com/nature/journal/v441/n7093/abs/nature04678.html
(All Figures were taken from the website above)
Margaret Noll, [email protected], last updated 3/15/2009, http://www.gen677.weebly.com
